A new class average function has been added into Mark entry by class.
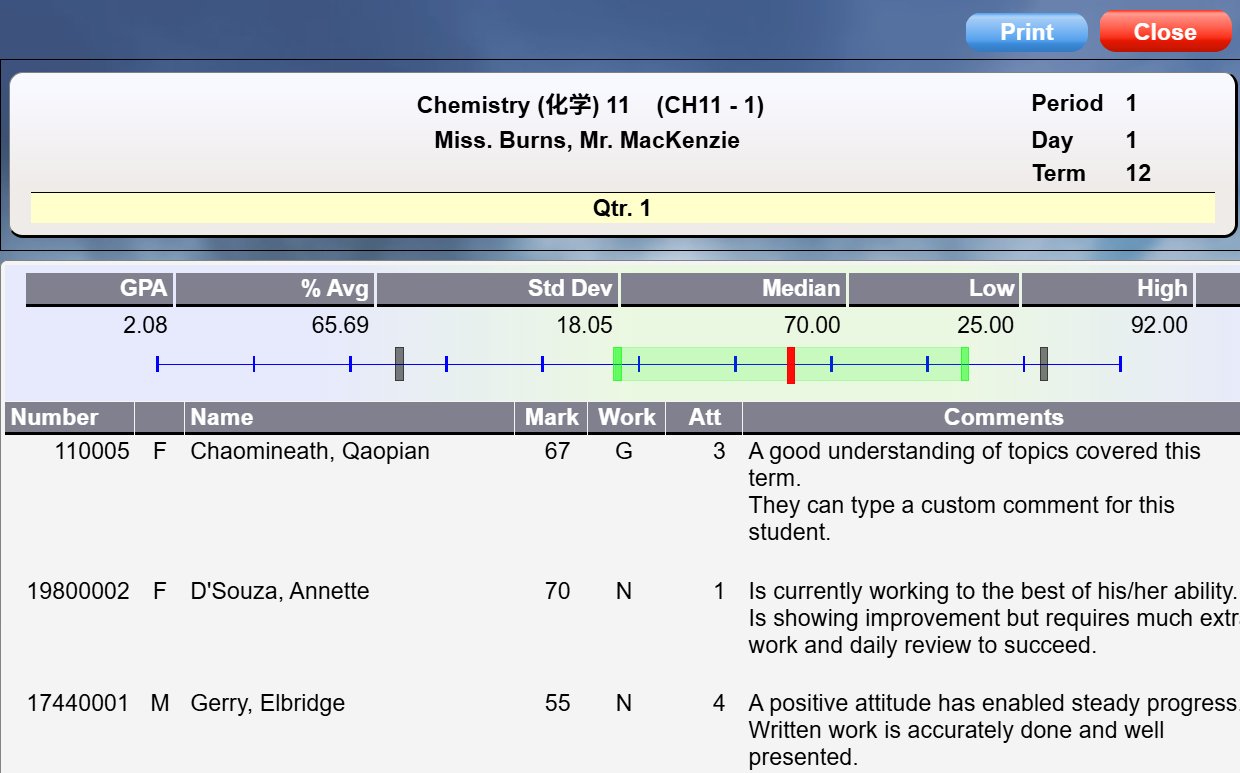
Now when teachers are entering marks into classes, the class average, standard deviation, lowest and highest mark are calculated automatically and shown in the class heading.
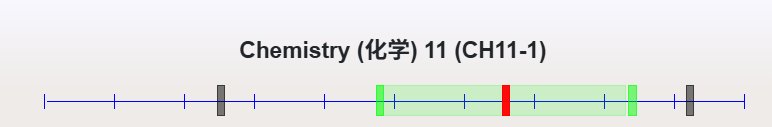
The class average chart shows the class average in red.
The standard deviation range is shown in light green, with the upper and lower bounds marked.
The lowest and highest mark in the class are show by the grey blocks.
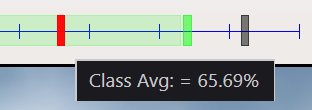
Move the mouse over the chart to get the details.
When you print the class list, the class average and all details are shown:
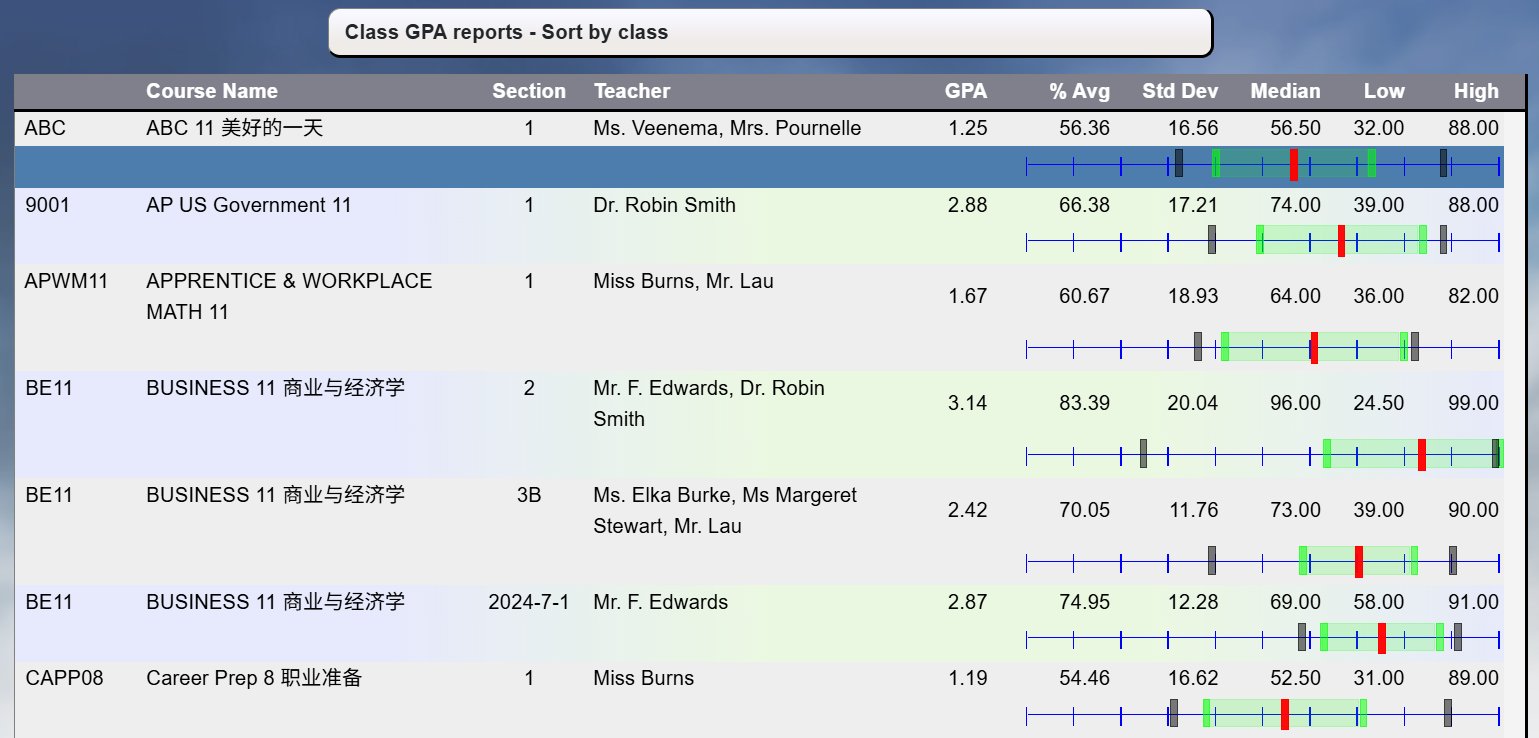
Administrators can print Class average/gpa reports.
Go to Grades, Reports, Class Avg/GPA reports.
Select the classes you want to print, and the report period to get this report: